Sauter, T. and Galos, S. P.: Effects of local advection on the spatial sensible heat flux variation on a mountain glacier, The Cryosphere, 10, 2887-2905, doi:10.5194/tc-10-2887-2016, 2016. [pdf]
Investigation Area
The model domain comprises a major part of the contiguous glaciated area covering the northern section of the Cevedale Massif, the summit of which is the highest point of the study area (3769 m a.s.l.). Three glaciers connected to each other are the focus of the study: Fürkele Ferner, Zufallferner and Langenferner. The surface area of the glaciers is about 6.62 km (2013) with an altitudinal extent from about 3750 m a.s.l near the summit of Hintere Zufallspitze, down to 2595 m a.s.l. at the lowest point of Zufallferner. The model domain includes a wide variety of topographic features such as steep slopes up to 50˚ glaciated and unglaciated (summit) ridges of various aspects, as well as larger glacier sections with smooth terrain and low slope angles. The mean slope angle of the glacierized terrain is 17◦. The topography can be regarded as (i) typical for many glaciers in the European Alps and (ii) highly suitable for investigating the complex interaction of large-scale (synoptic) forcing and small-scale topographic features
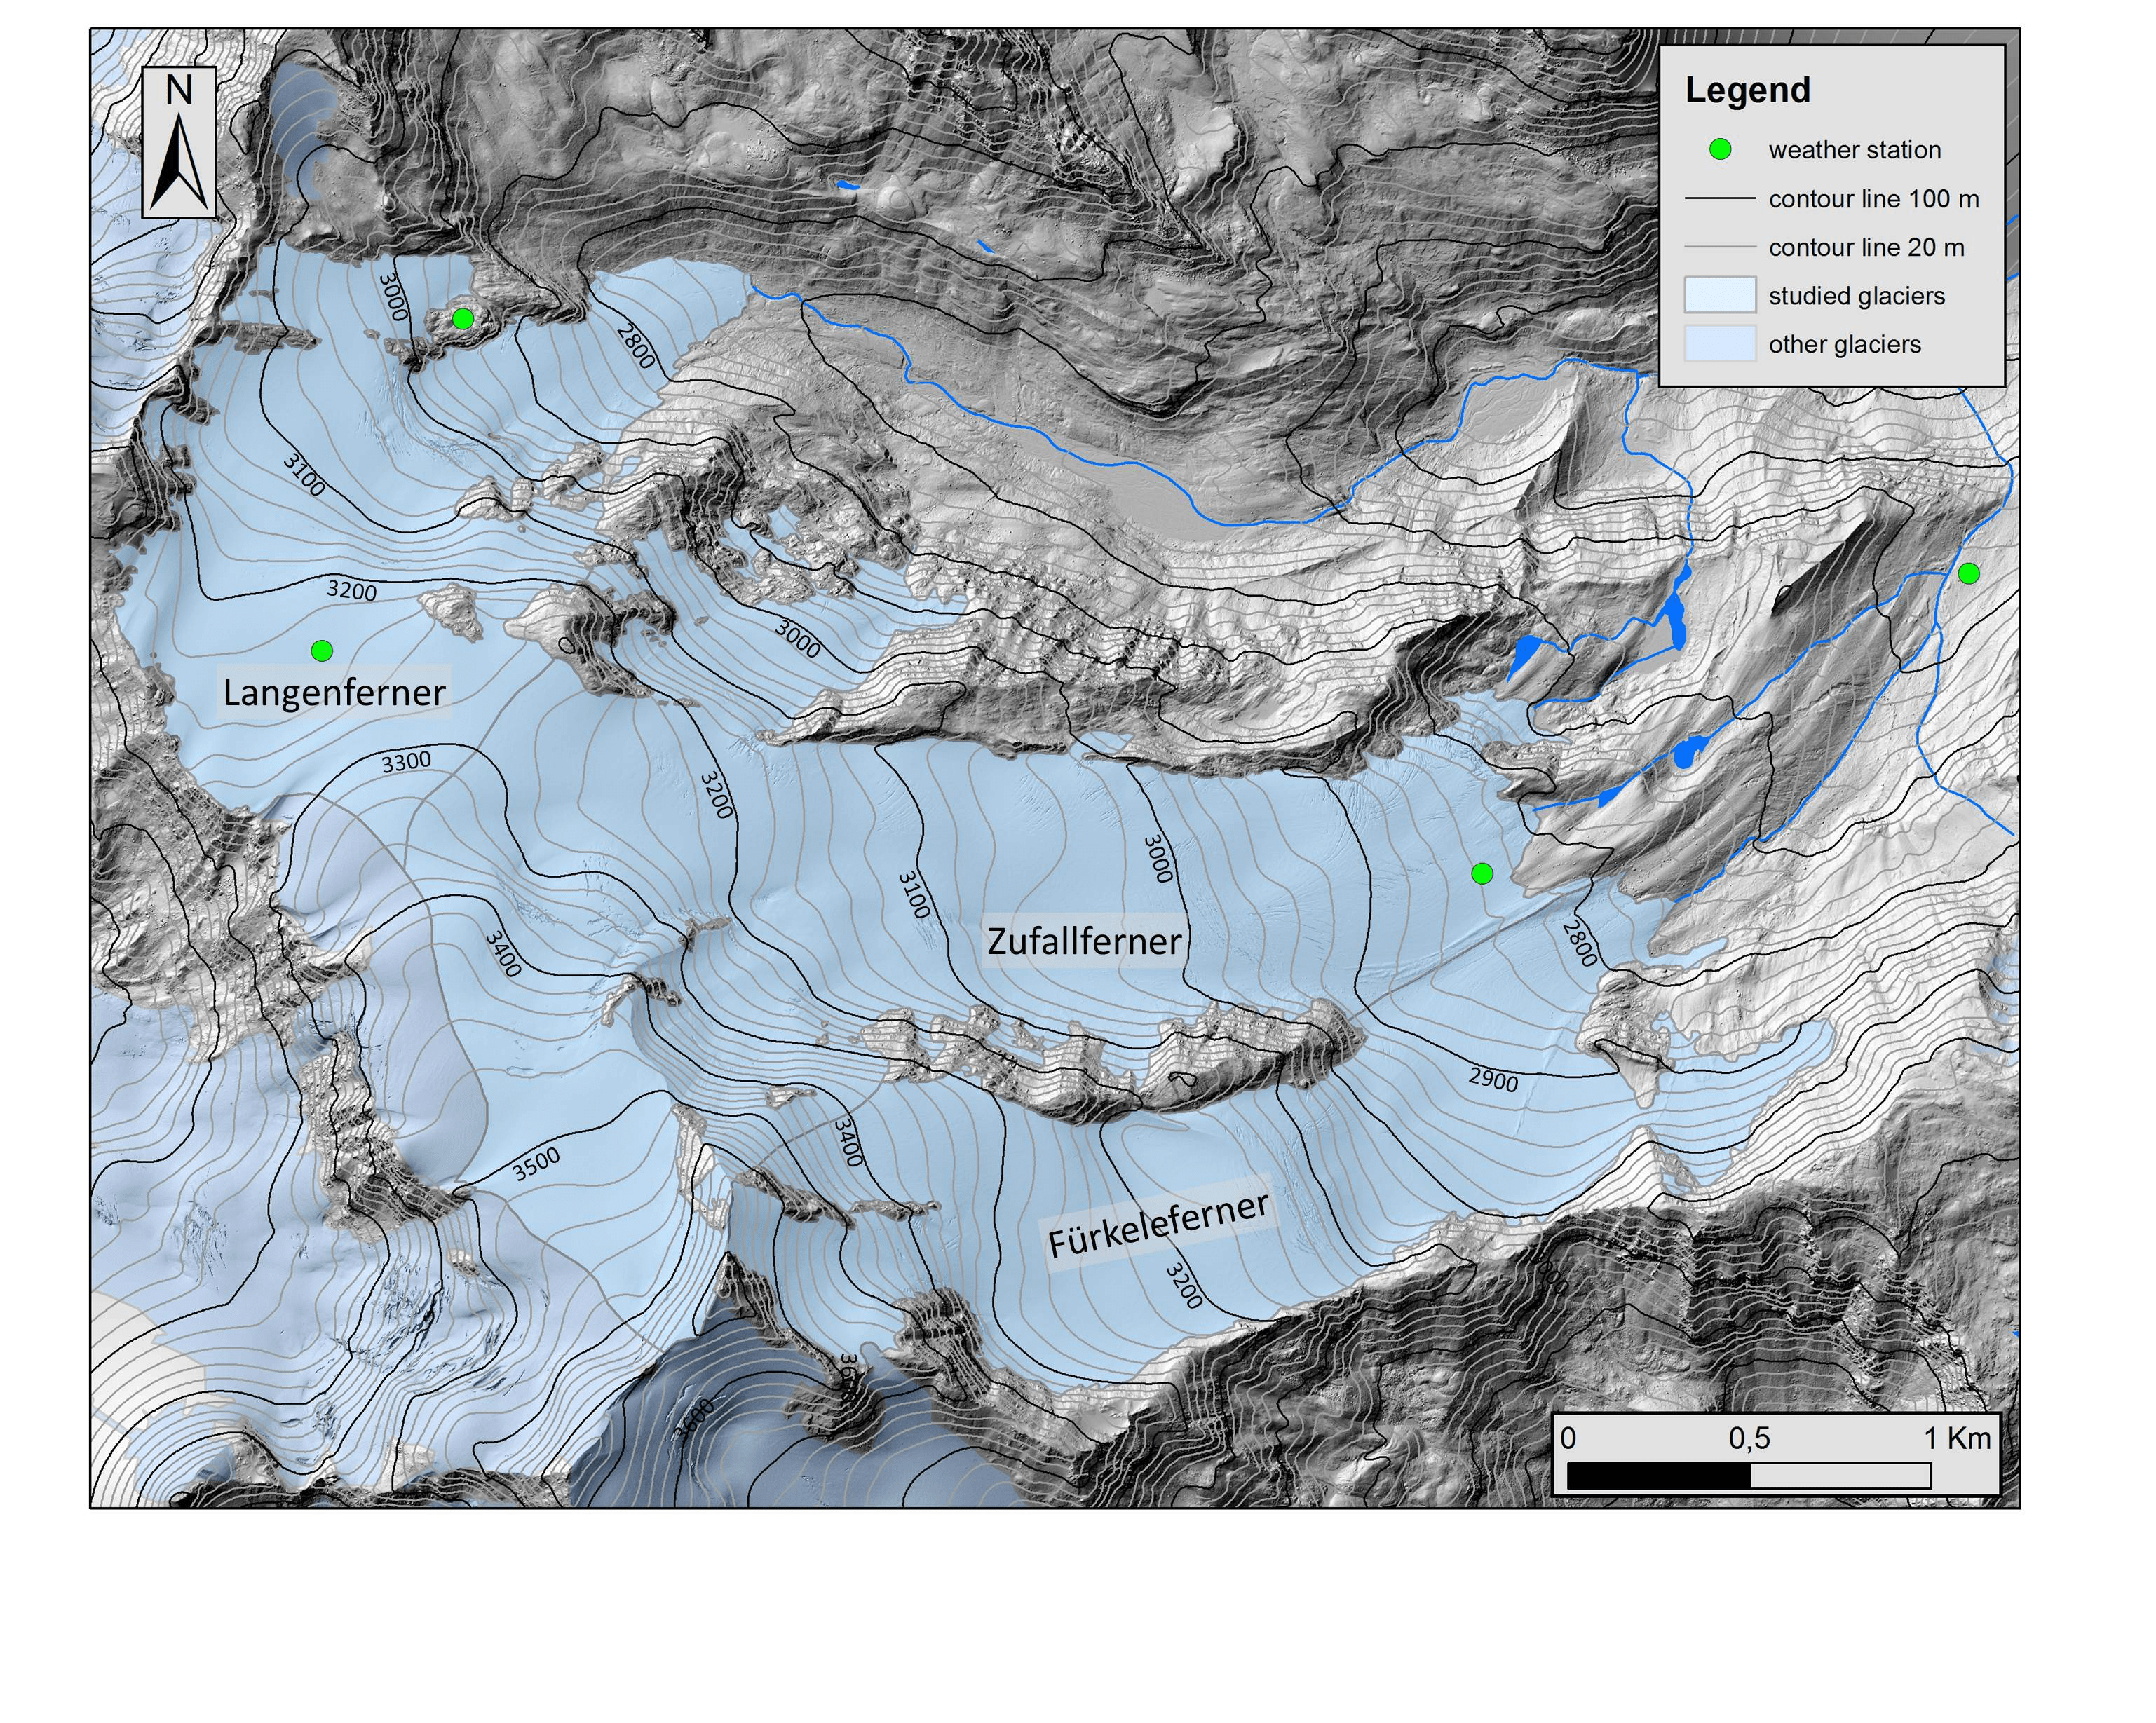
Figure 1. Map showing the surface topography of the studied glaciers and the surrounding terrain.
Wind fields and sensible heat flux variations
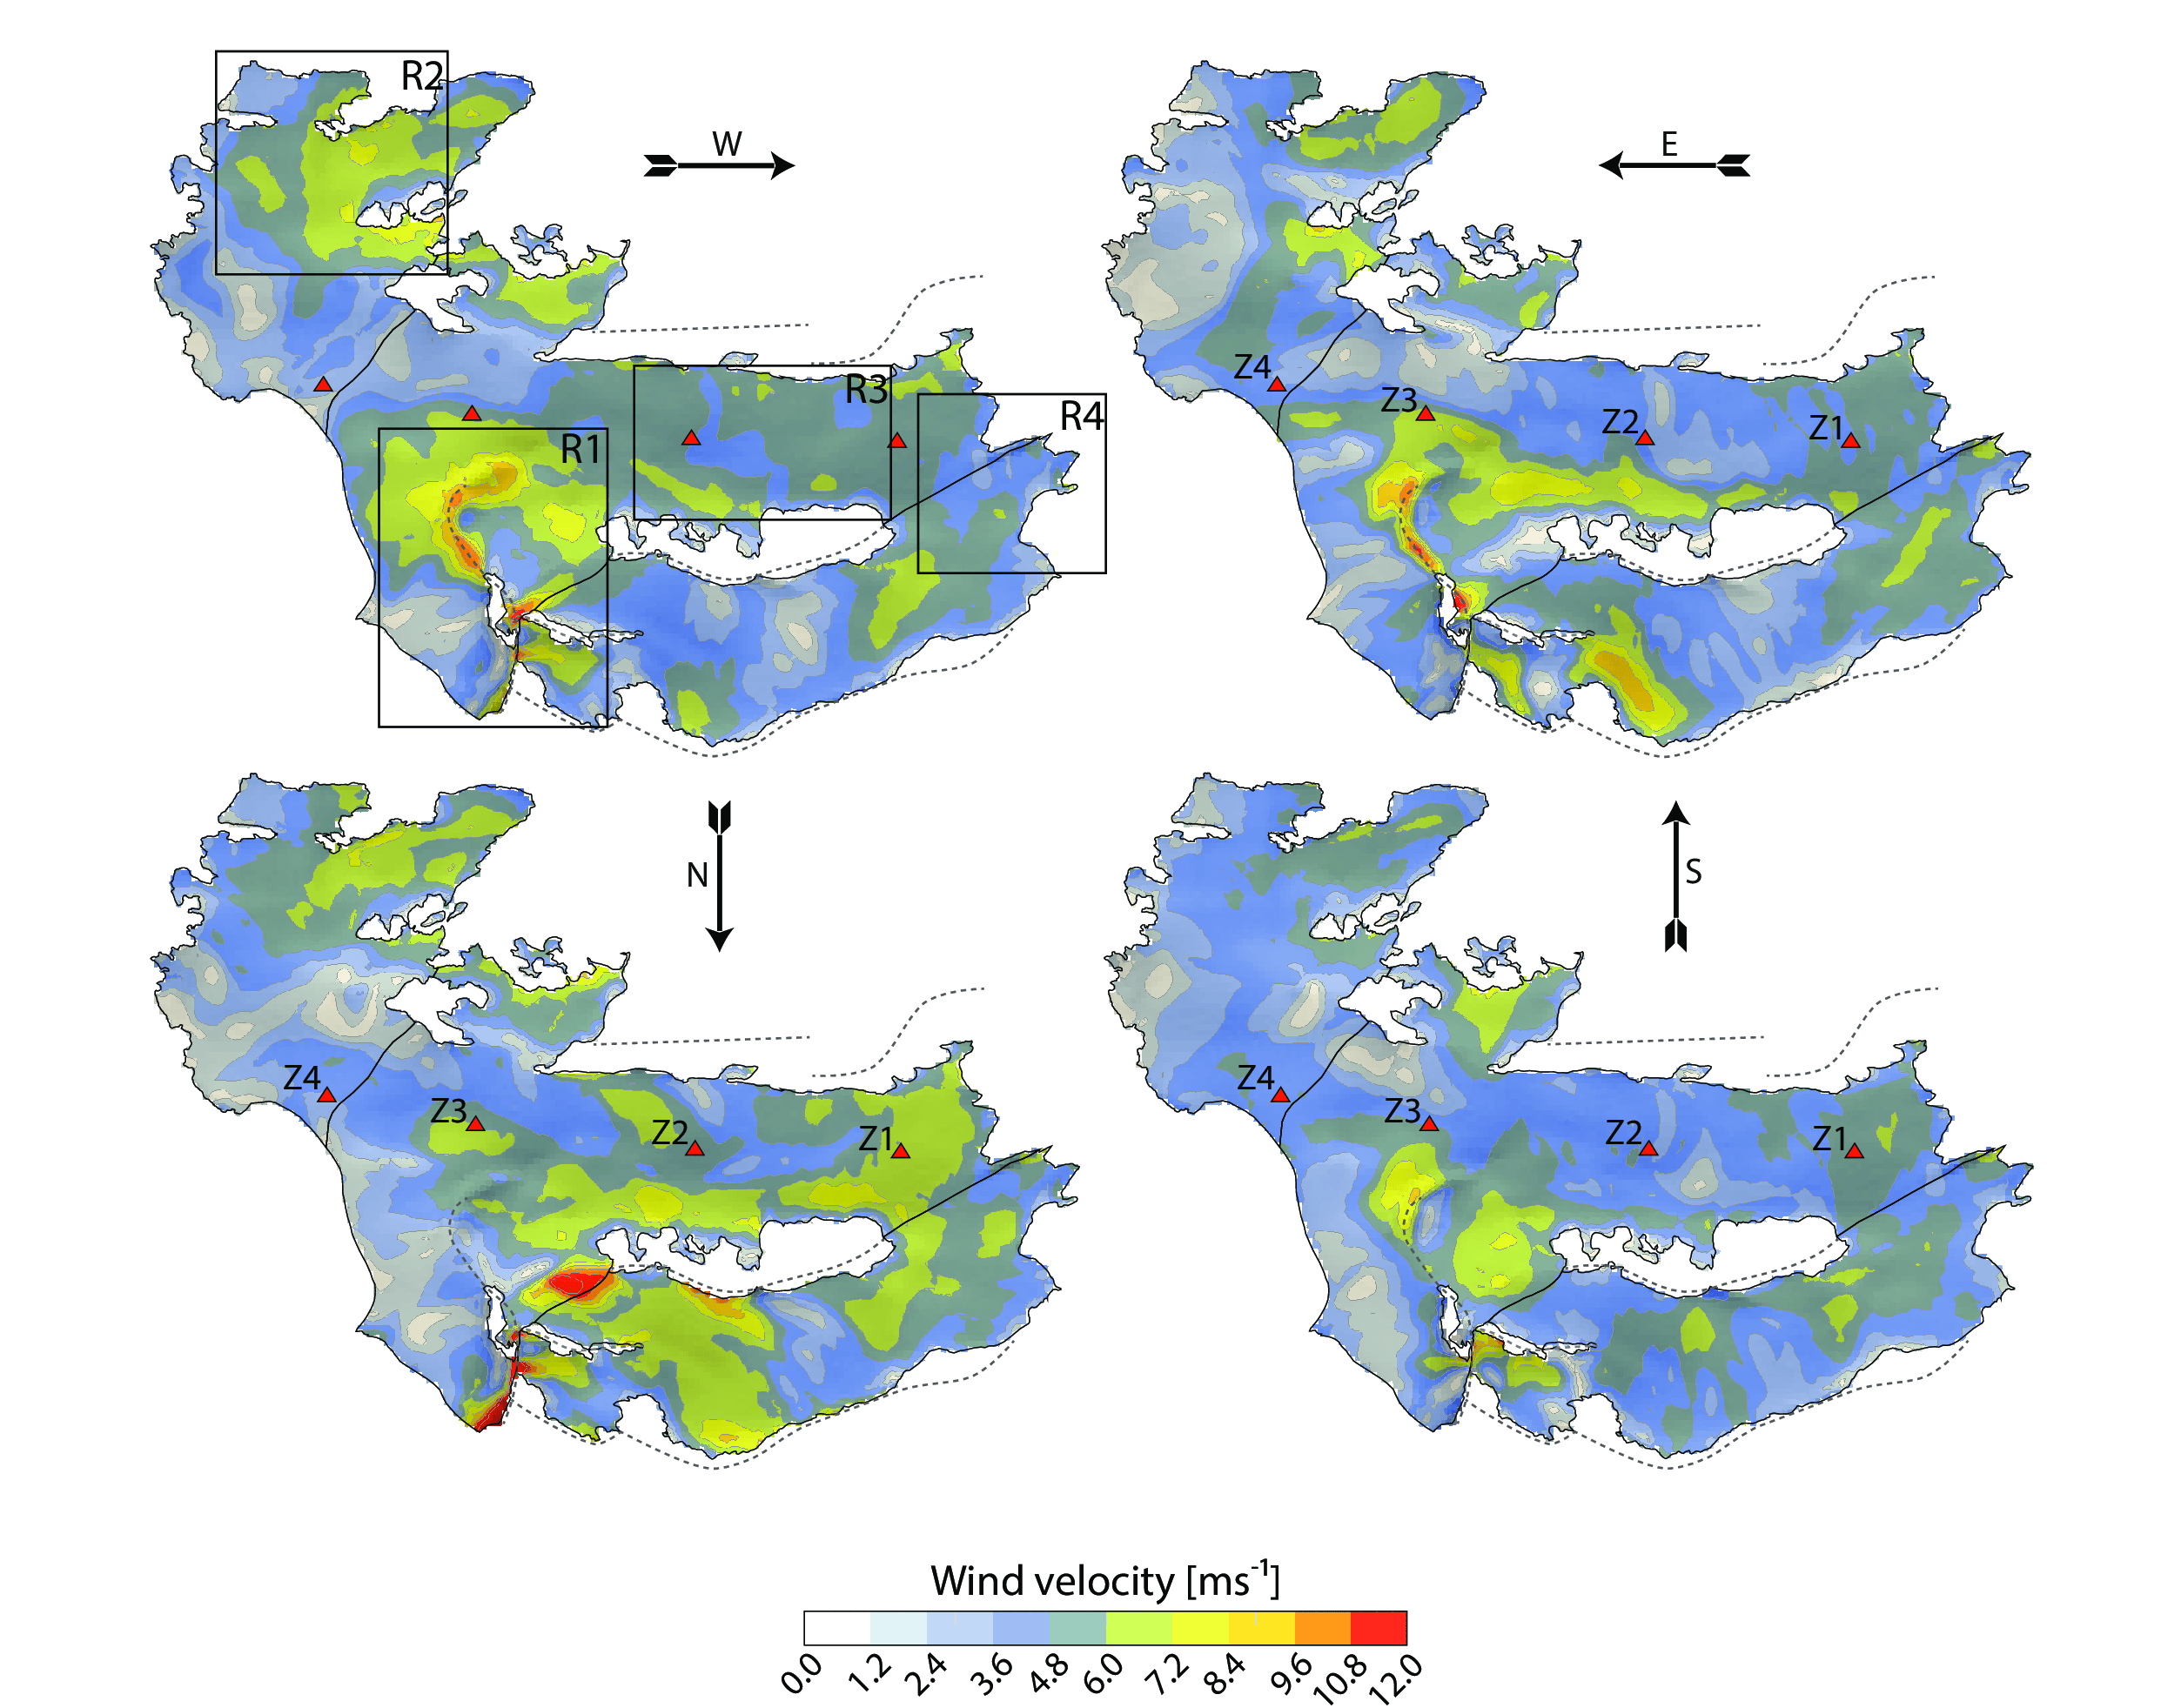
Figure 2. Mean velocity of the surface wind fields (2 m) for each of the four Large-Eddy case experiment. The four boxes R1–4 and the sites Z1–4 define regions and locations on the glacier which are used for discussion in the results section. The grey dashed lines represent sharp ridges in the study area.
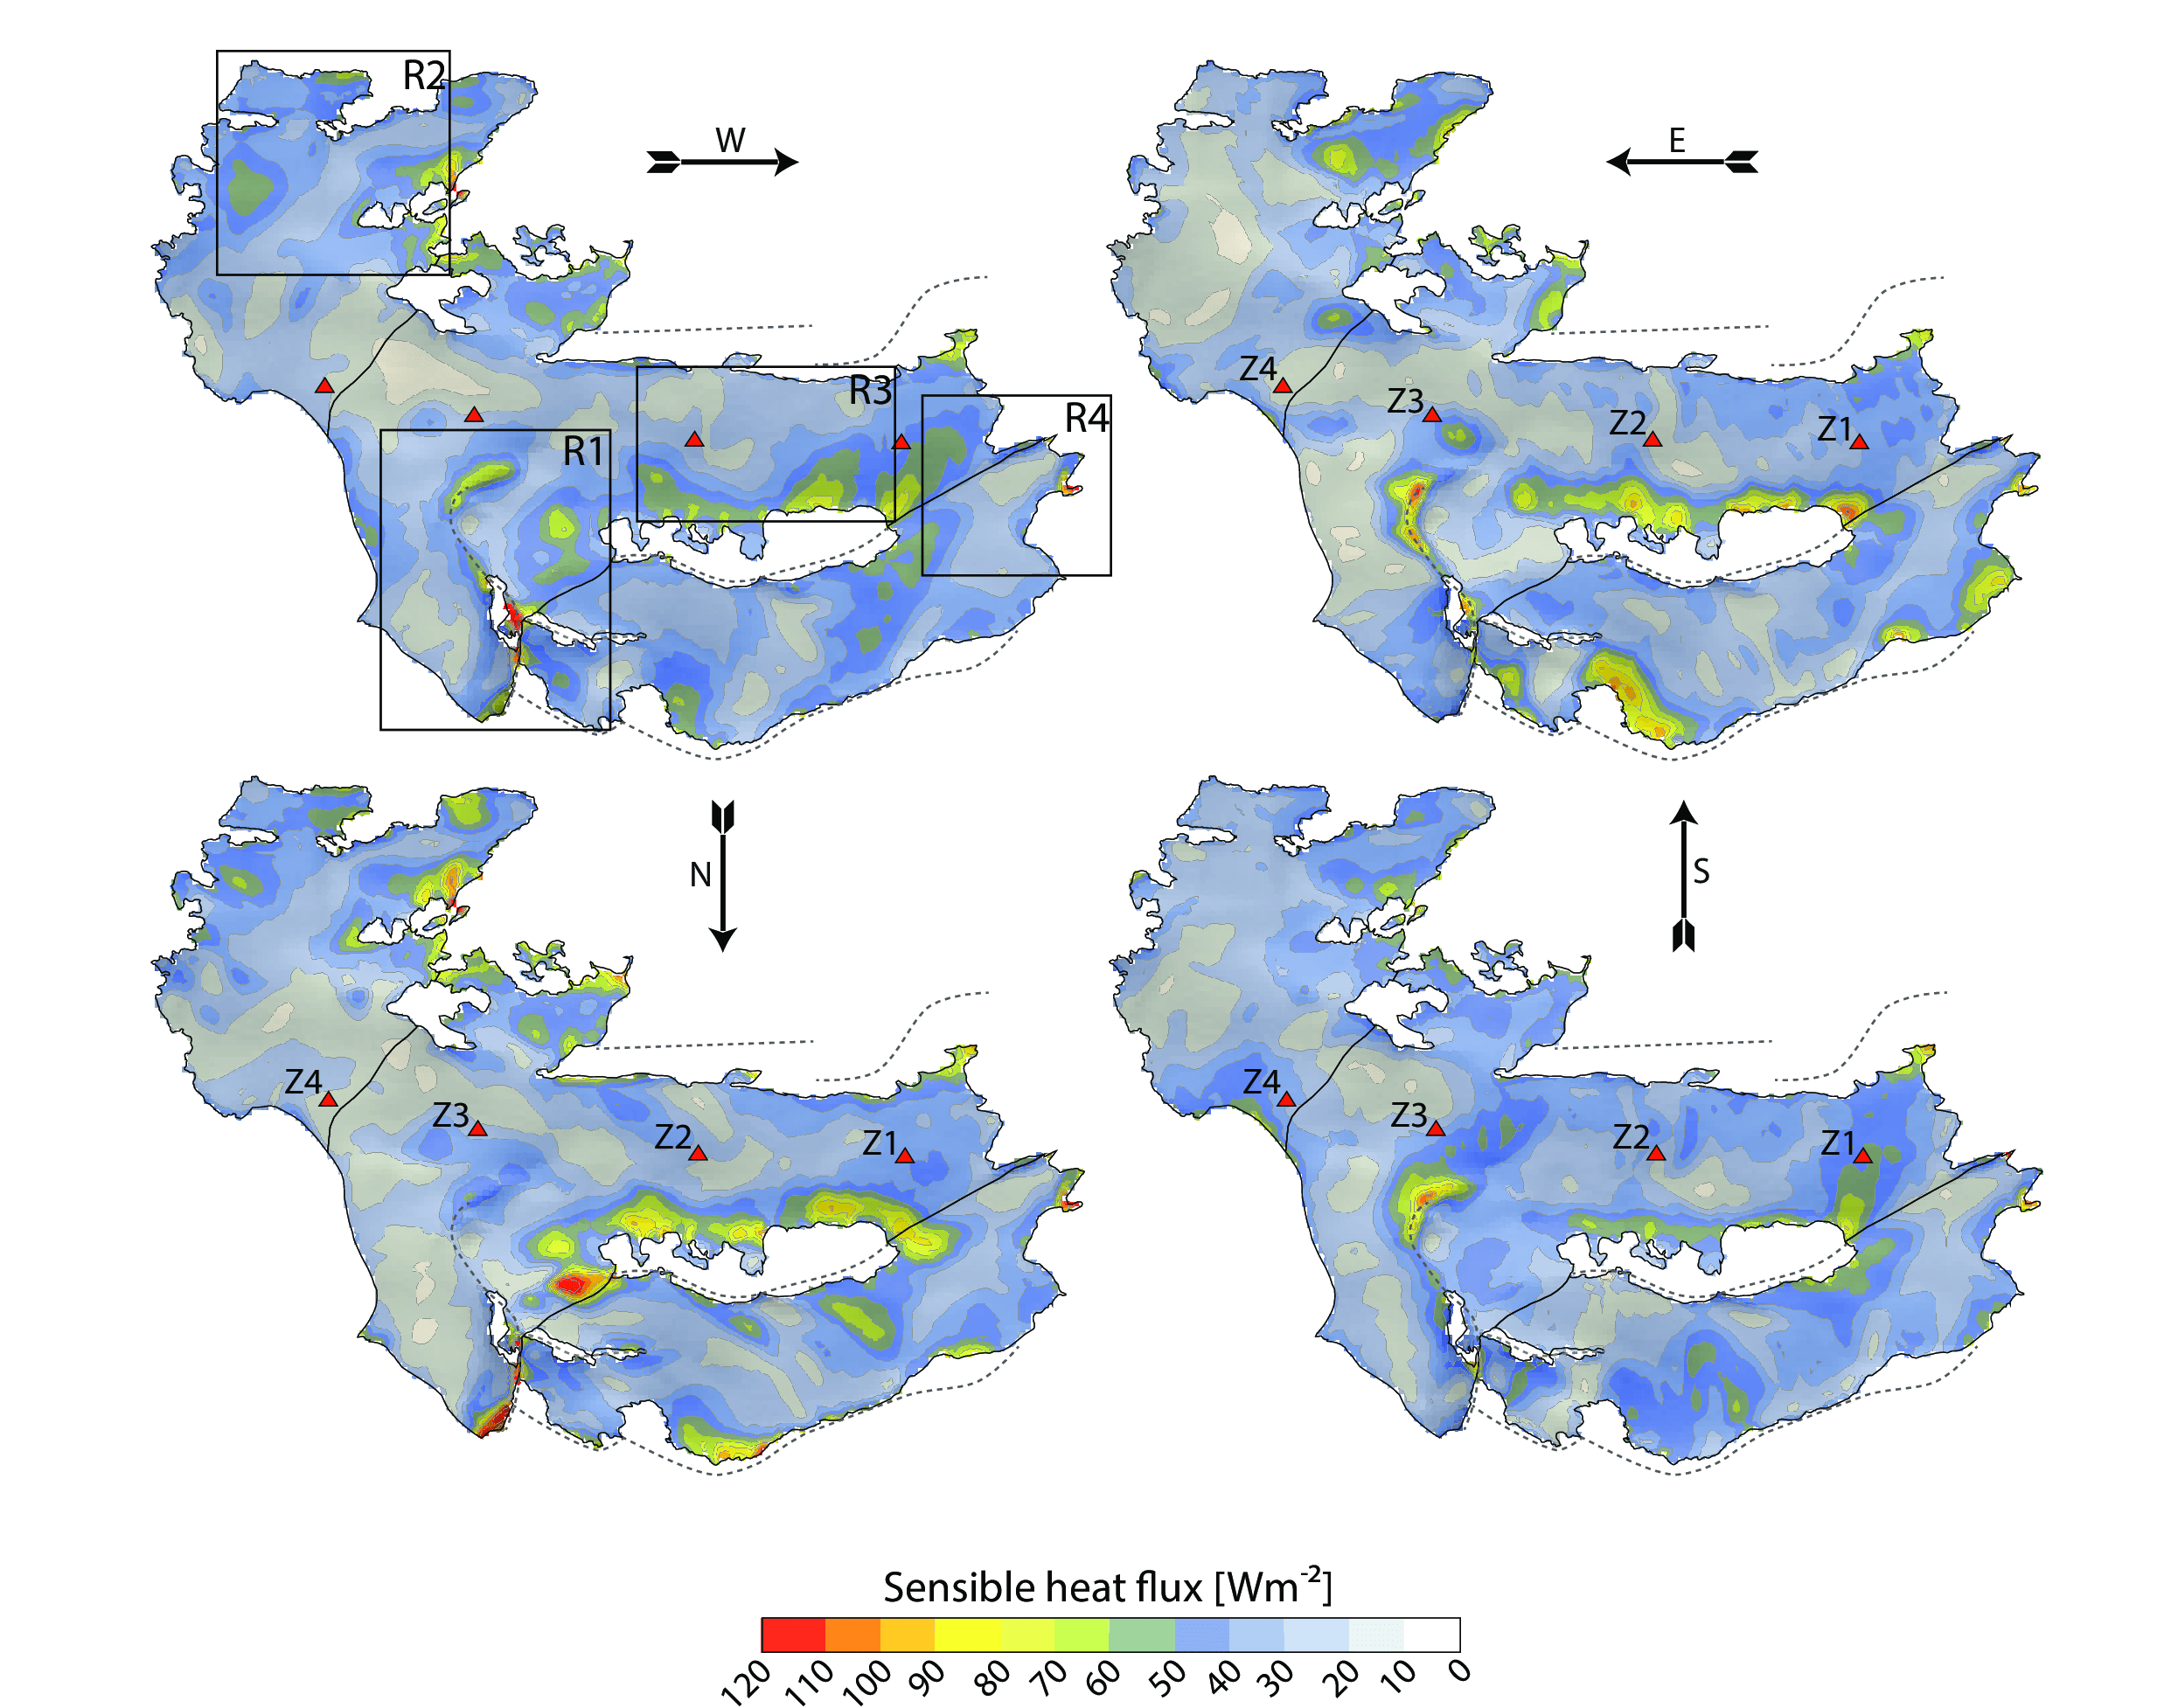
Figure 3. Mean sensible heat flux from the LES runs for each of the four case experiments.
Large-Eddy Simulation vs. Bulk Approach
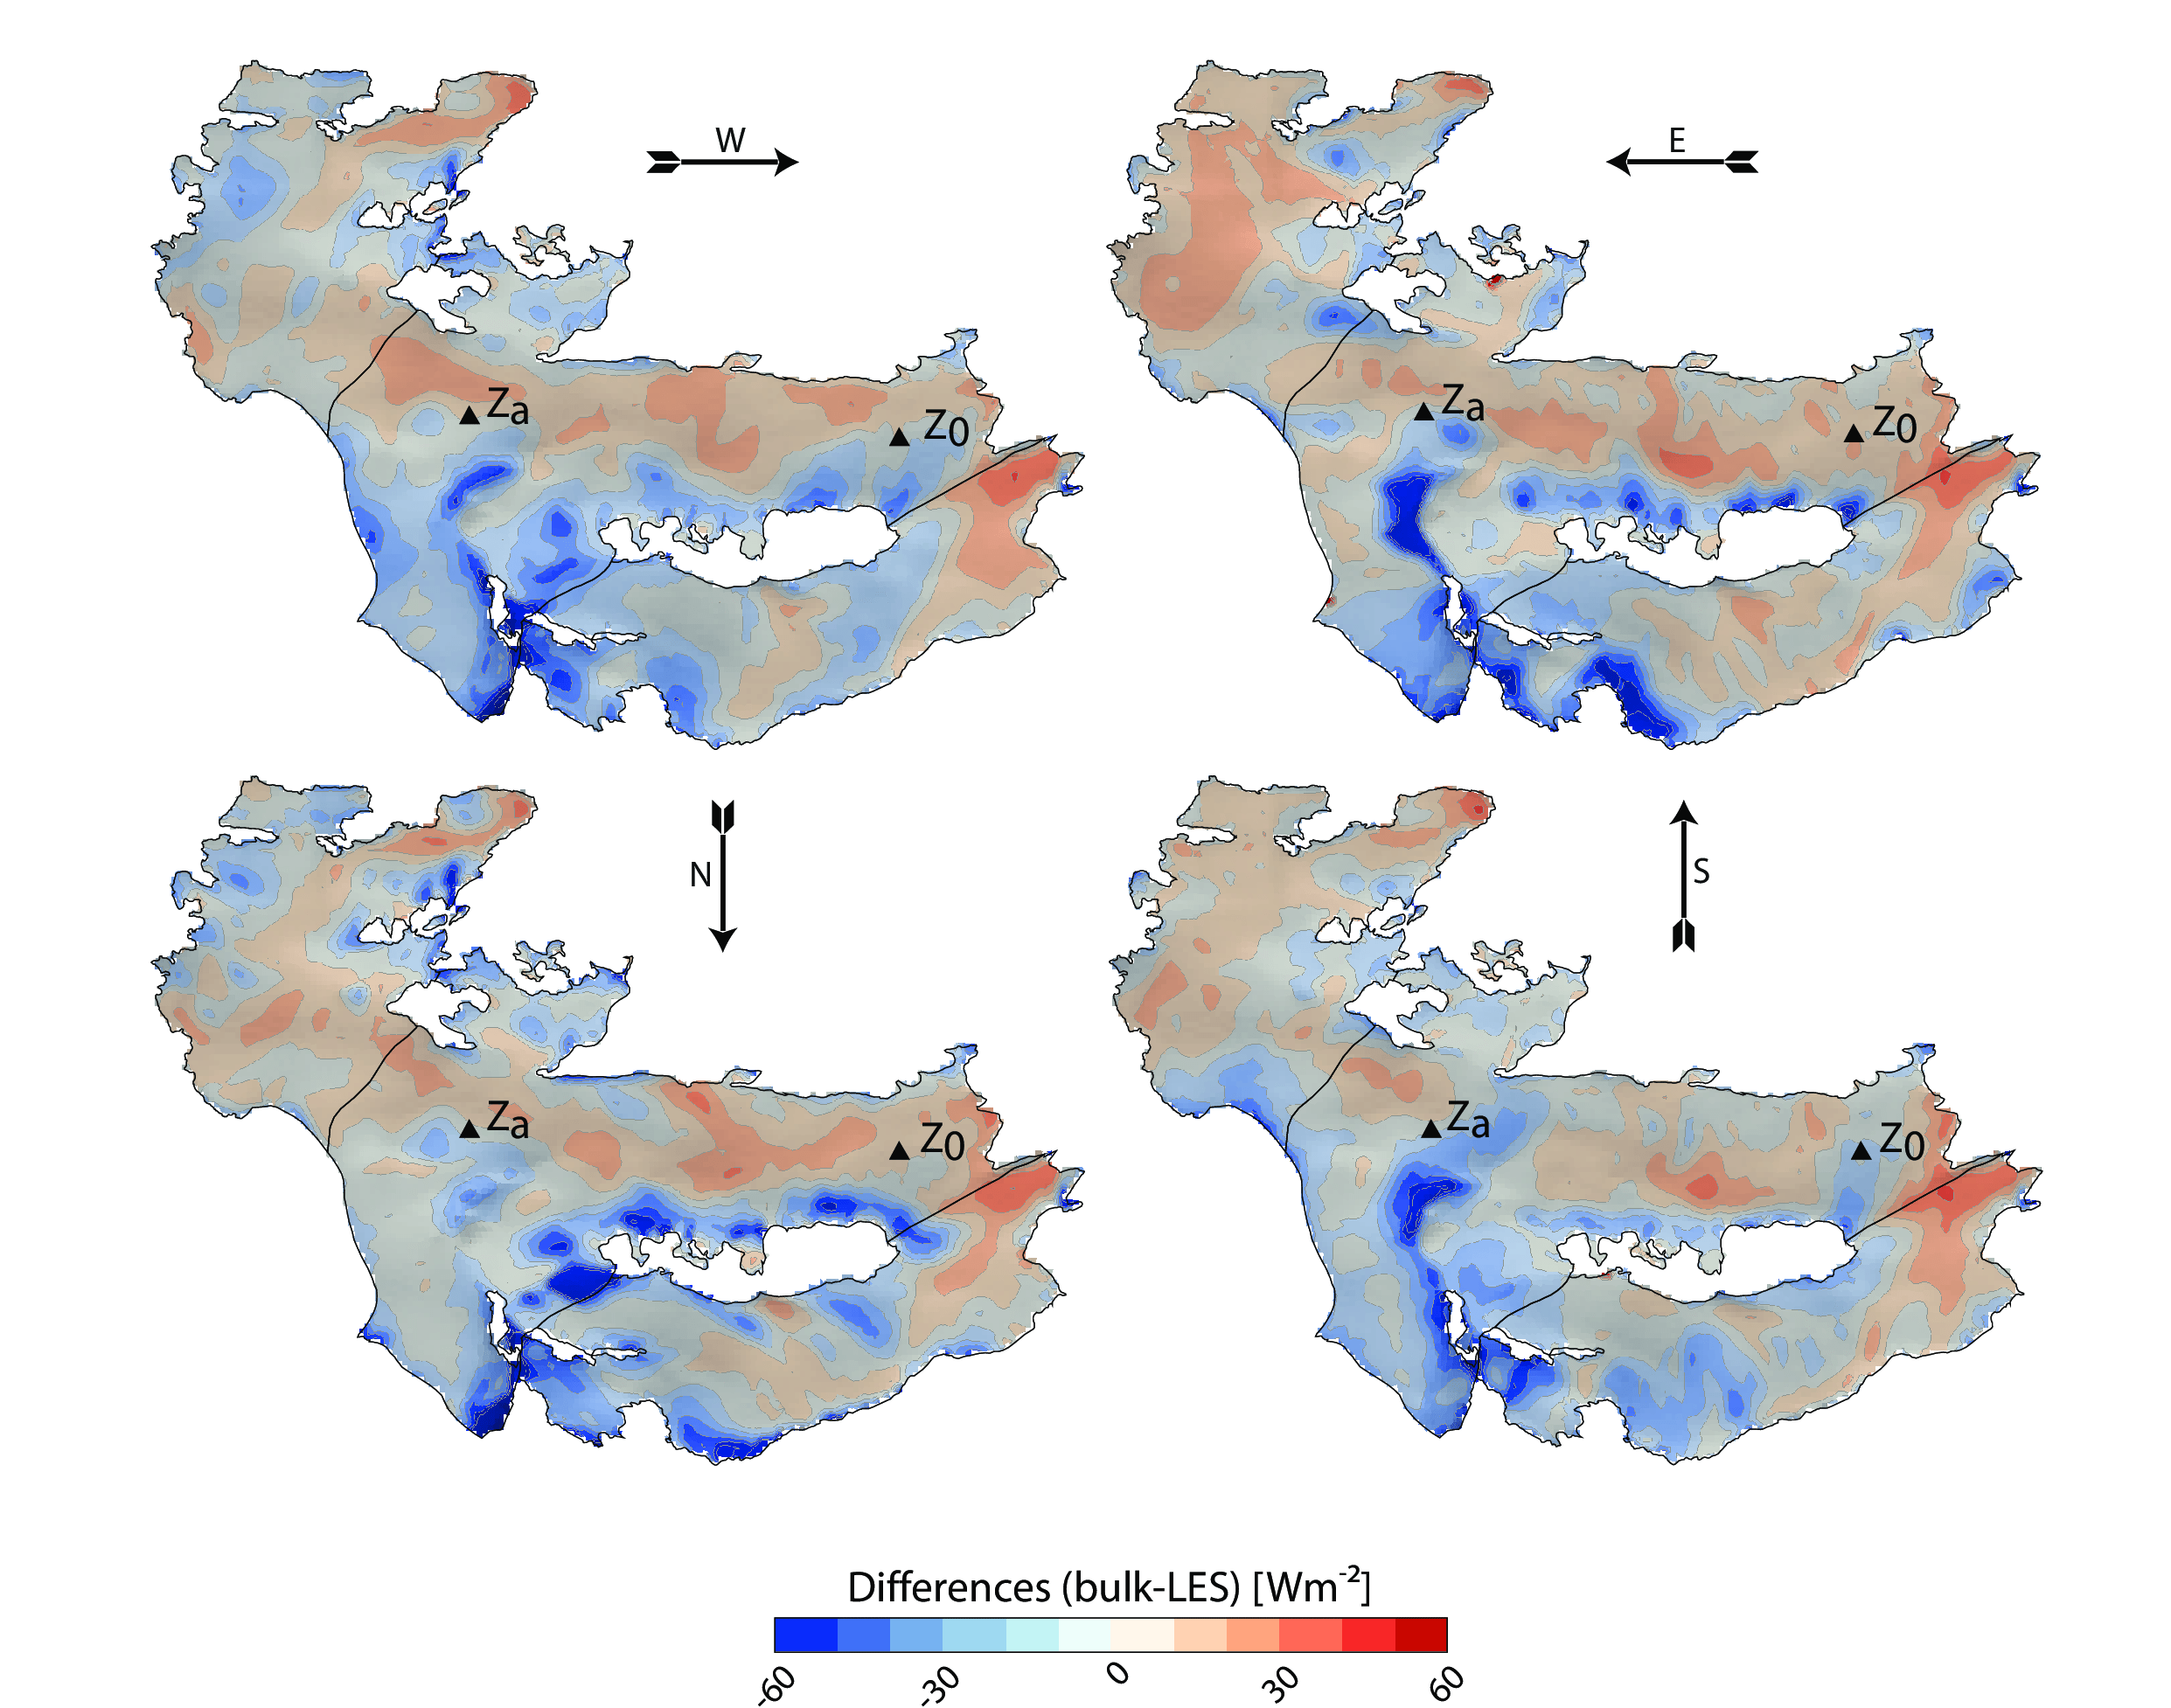
Figure 4. Differences in the mean surface sensible heat fluxes between the LES and the bulk method for different wind direction. Positive differences correspond to an overestimation of the surface heat flux by the bulk approach
Turbulence characteristics and intermittency
The standard deviation of the vertical velocity fluctuations is heavily right skewed on the glacier (see Sauter and Galos, 2016), which is a good indication of occasional mixing events embedded within the turbulence. Several studies observed intermittent turbulent mixing events in the SBL above glaciers and analyzed their impact on the surface energy balance (e.g., Cullen et al., 2007; Oerlemans and Grisogono, 2002; Söderberg and Parmhed, 2006; van den Broeke, 1997; Smeets et al., 1998; Munro and Davies, 1978; Hoinkes, 1954; Kuhn, 1978; Munro and Scott, 1989). Single mixing events may have only little impact on the time-averaged quantities, but the intermittent heat supply can be substantial for the melt energy (Oerlemans and Grisogono, 2002; Dadic et al., 2013; Mahrt, 2010; van den Broeke, 1997). Local turbulent mixing events are driven by the characteristics of local turbulence, submeso motions, and the large-scale flow (Helgason and Pomeroy, 2012; Poulos et al., 2007; Högström et al., 2002). Non-local topographic effects,such as gap flows or bluff bodies, can favor the probability of periodic occurrence of burst events at a given point on the glacier, shaping the local micrometeorological conditions (Söderberg and Parmhed, 2006; Litt et al., 2015).
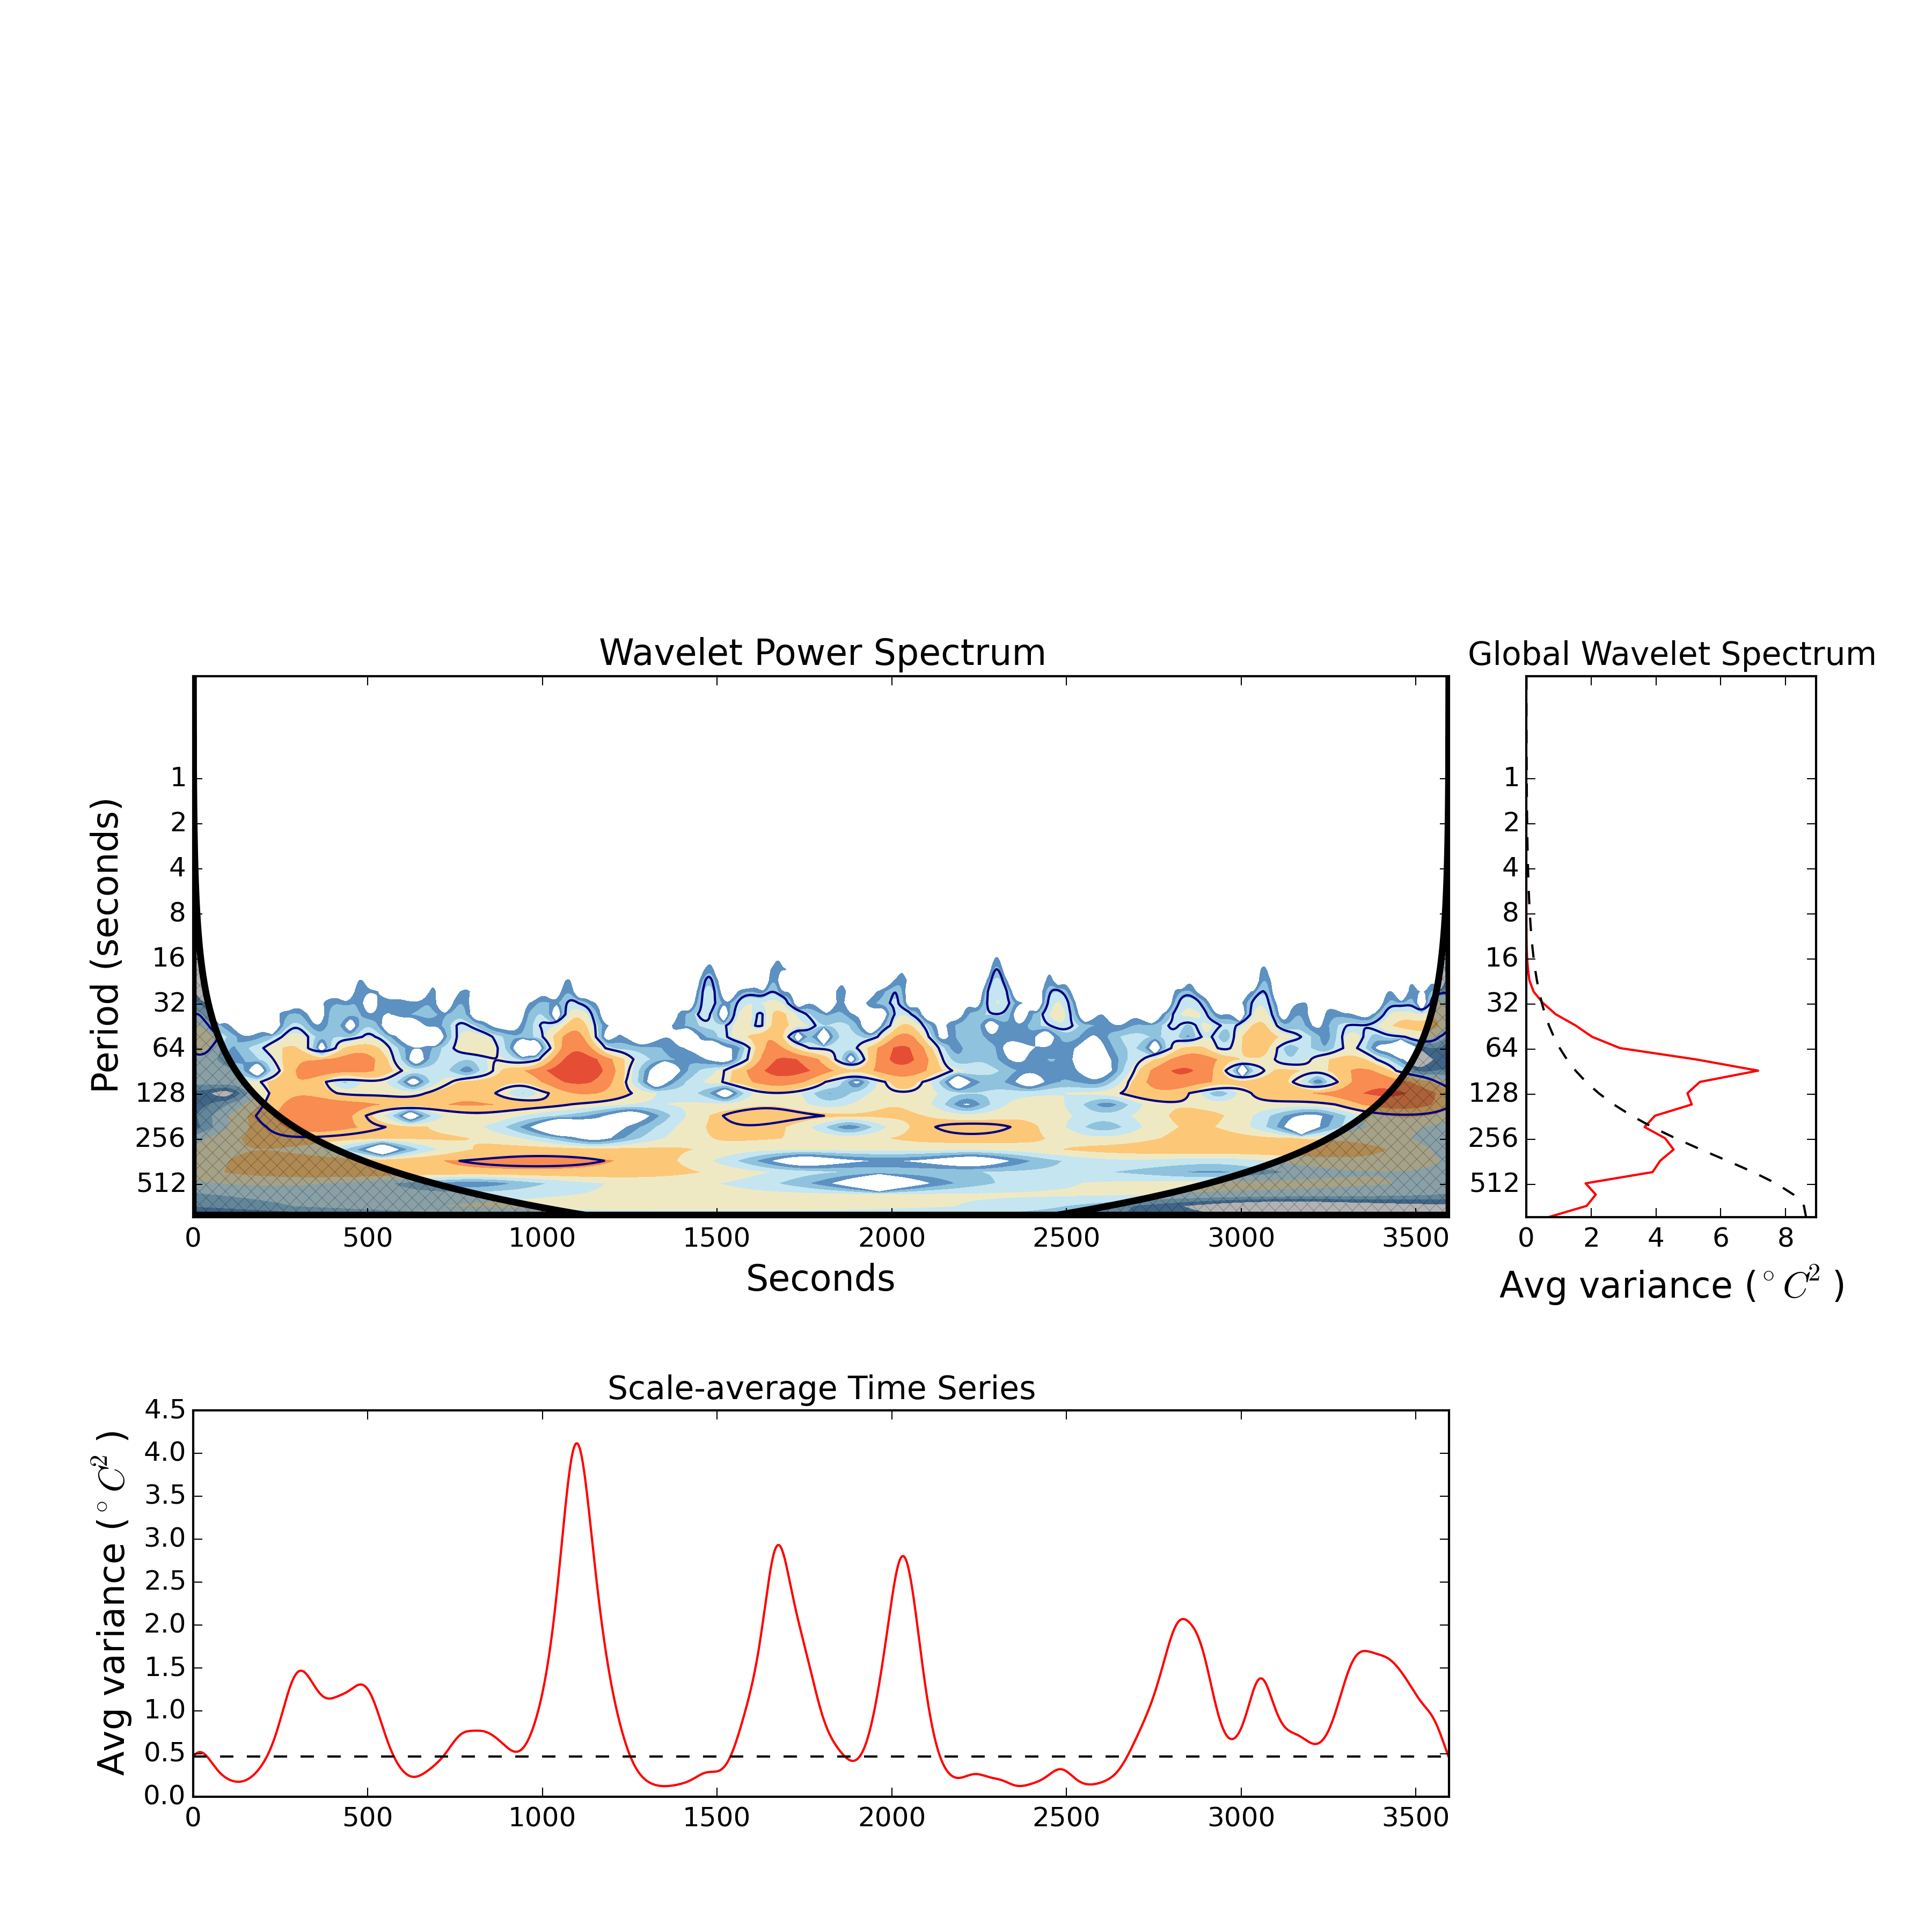 Figure 5. Example of a rectified wavelet power spectrum of the temperature signal for southerly flow (upper left column), the time average-wavelet power spectra (right column), and the scale-averaged time series (lower left column). Red and blue indicate high and low scaled powers (in base 2 logarithm), respectively. Black lines outline the wavelet spectrum at a 95 % confidence level. The cross-hatched region marks the cone of influence, where edge effects become important.
Some theory on glacier winds, turbulence and intermittency
Given the complex mountain topography around alpine glaciers, it is not trivial to find a direct link between the large-scale atmospheric state, which is usually provided by coarse models and the local-scale weather conditions at an individual glacier. In most cases this requires a profound understanding of the interaction of large-scale flow and the thermally induced wind systems. In particular, katabatic flow associated with the stable boundary layer (SBL) develop above glacier when advection of warm air over the much cooler glacier surface leads to a strong strati cation and downward directed buoyancy flux. The permanent cold glacier surface produces a shallow cold air layer above the ground, which drains down the slopes following the local topography. The development of persistent shallow (5-100 m) downslope winds above glaciers are a well known phenomena and commonly referred to as glacier wind. The characteristic and intensity of the glacier wind is governed by the interplay of buoyancy, surface friction and entrainment at the upper boundary of the SBL. Near the surface the wind is usually calm and the wind velocity gradually increases with height, frequently forming a pronounced low-level jet (LLJ). Above the LLJ winds gradually changes to geostrophic.
Under stable conditions the buoyancy flux (BD, buoyancy damping) suppresses turbulence near the surface, representing a loss term for the turbulent kinetic energy (TKE) budget, thus supplementing the viscous dissipation. Turbulence is mainly gained by shear production (SP) through interactions of Reynolds stresses and the mean velocity gradients. There is a delicate balance between the generation of turbulence by shears and damping by buoyancy. If the buoyancy destruction due to strong vertical strati cation exceeds the generation by shears, turbulence might eventually extinguish. The dimensionless Richardson number (Rf) expresses the ratio of these fluxes and is often used to characterize the dynamic stability and capability of the flow to remain turbulent.
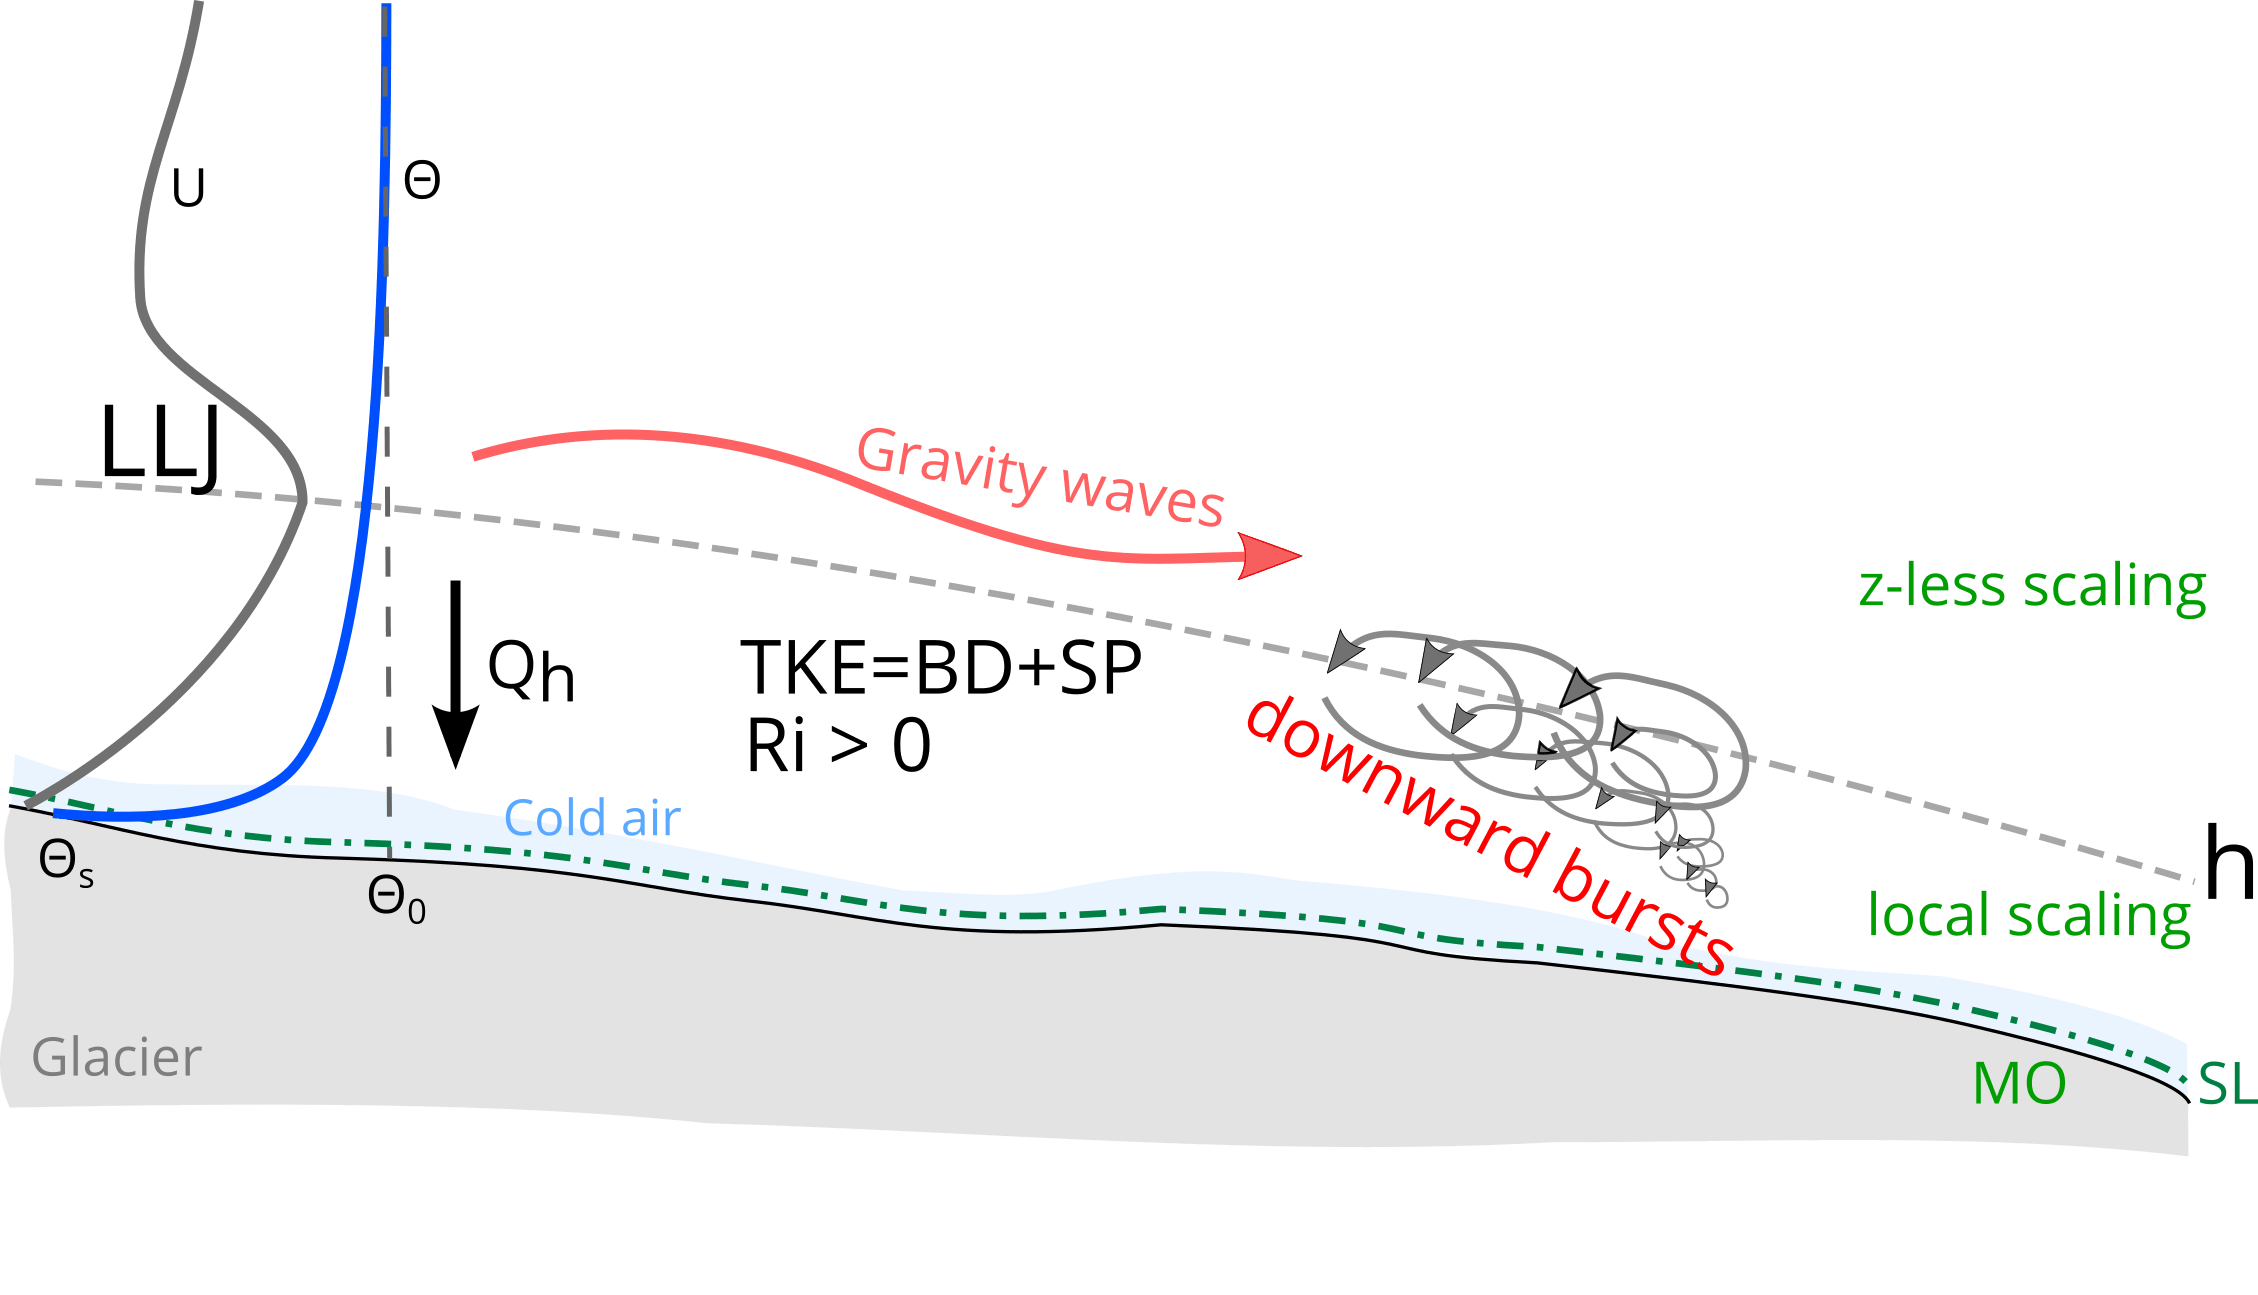 Figure 6. Boundary layer processes over mountain glaciers. Shown are the wind profile (U), potential temerature profile (theta), low-level jet (LLJ), downward directed heat flux (Qh), similarity relationships (local and z-less scaling regions) and the origin of downburst events.
According to the Kolmogorov energy-cascade, the rate of dissipation is determined by the transfer of energy from the largest energy-containing eddies through the inertial subrange [Pope, 2000]. The buoyancy flux mainly impacts the largest scale of motions and shuts down the energy transfer to smaller scales. In particular in very stable conditions, (Rf > 1), the strong downward heat flux may completely suppress turbulence and the boundary layer can develop an upside-down character, where turbulence and flow are detached from the surface [Derbyshire, 1990; Mahrt, 1999]. The decoupling can be accompanied by an acceleration of the flow aloft and the development of a LLJ [Smedman et al., 1997]. Generation of turbulence by strong wind shears in the LLJ region may temporarily recouple the elevated turbulence with the surface. Triggered by the wind shears, isolated events of strong turbulent mixing of heat and momentum can occur (downward bursts). The mixing process reduces the shears and, consequently, the production of turbulence. During mixing, the destruction of turbulence by buoyancy becomes the important term (Rf increases) and turbulent ceases. The relatively quiescent boundary layer allows again to build up the shears.
[/full_width]